WHAT IS PICTOGRAPH?
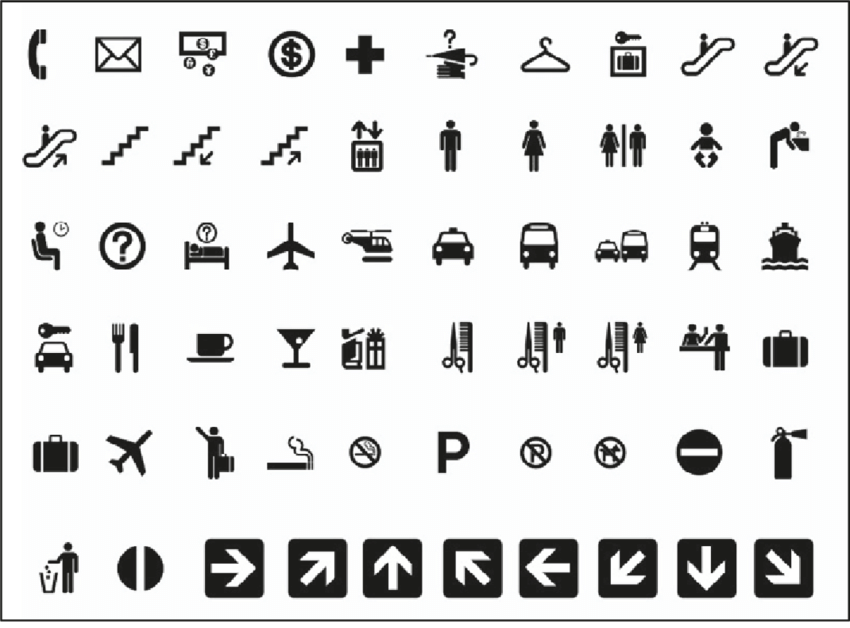
A pictograph, also known as a pictogram, is the pictorial representation of data using images, icons, or symbols. We can represent the frequency of data while using symbols or images that are relevant using a pictograph. Pictographs are one of the simplest ways of representing data.
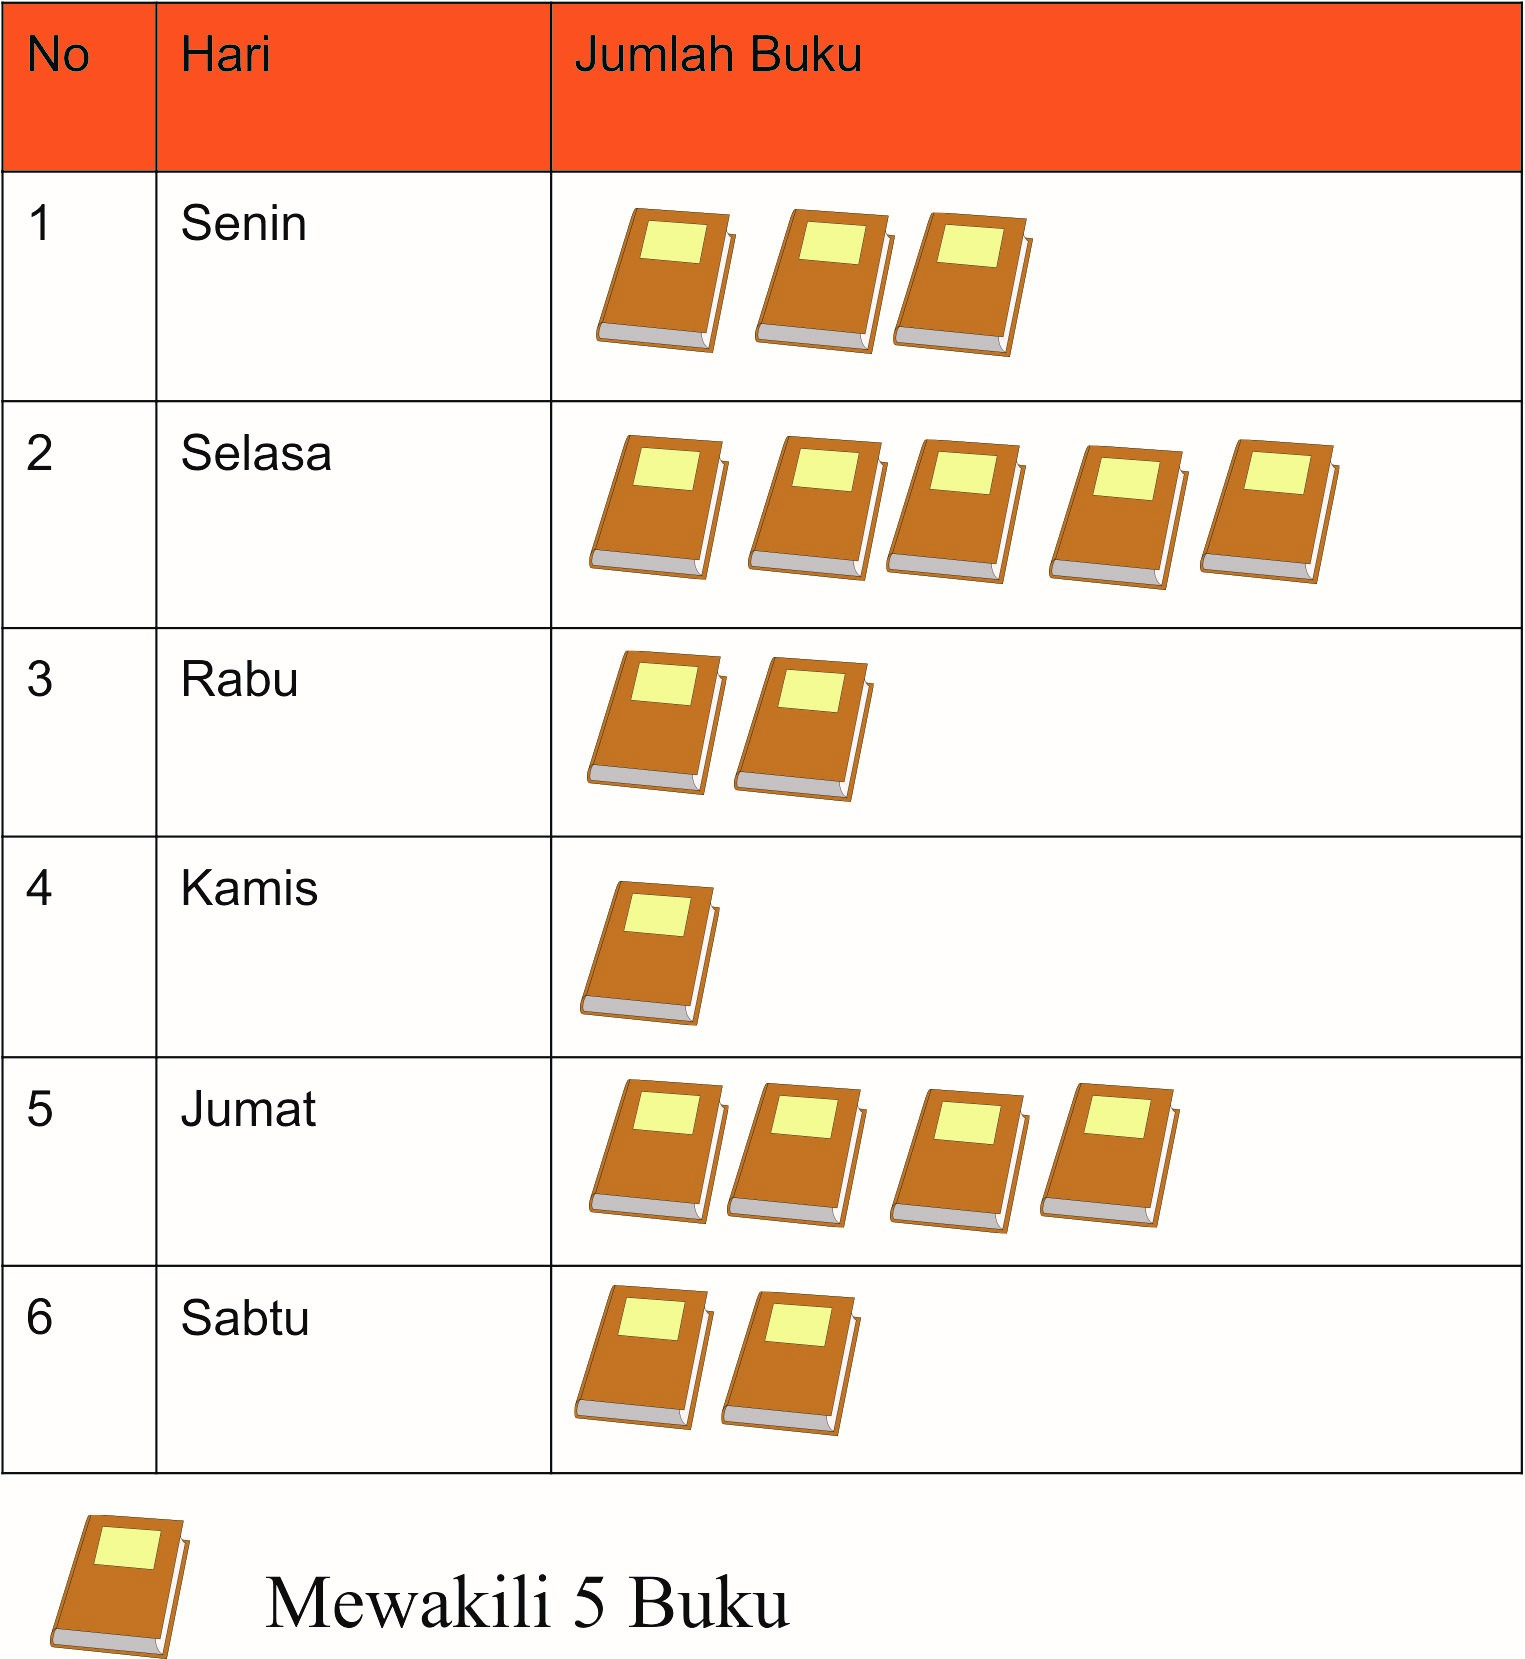
EXAMPLE PICTOGRAPH :
LET'S WATCH THIS VIDEO MY DEAR❤️
This video about tally marks
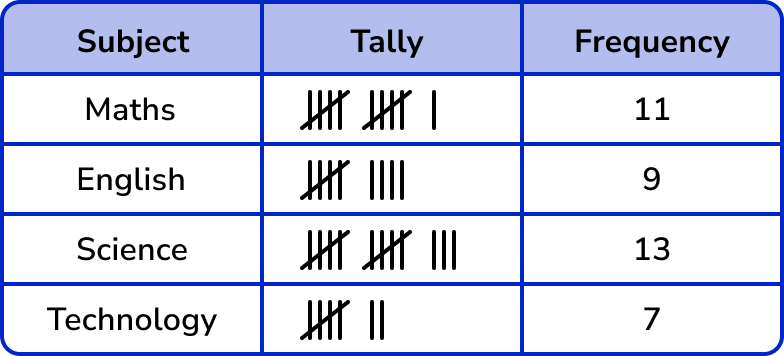
WHAT IS TALLY?
Tally marks, also called hash marks, are a form of numeral used for counting. They can be thought of as a unary numeral system. They are most useful in counting or tallying ongoing results, such as the score in a game or sport, as no intermediate results need to be erased or discarded
For Example: